



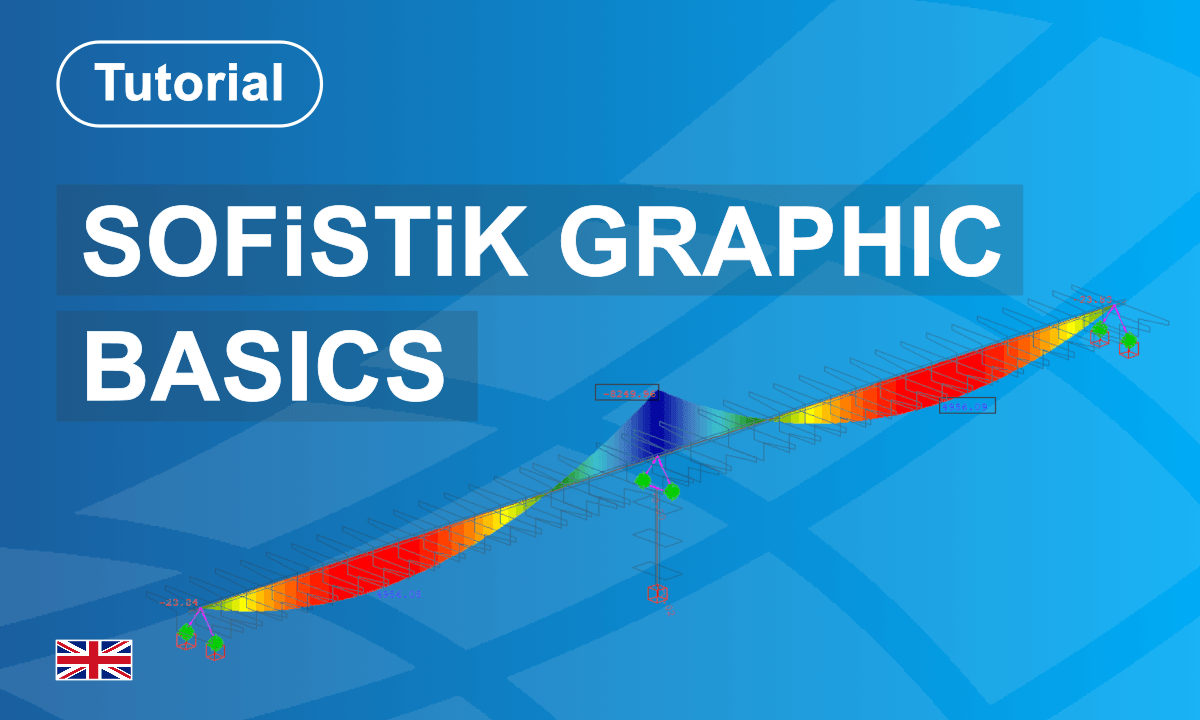
SOFiSTiK Graphic – Visualization, Documentation and Graphic Management
Course modified date: 15 August 2026
In this course, you will learn how to use SOFiSTiK Graphic to visualize, review and document structural analysis and design results. You will configure toolbars, search for structural and finite elements, manage selections, create cuts and customize graphical representations. You will also learn how to create graphics, pictures and layers, generate interactive graphics, integrate them into reports and improve automatically generated report content. Through practical examples and exercises, you will develop efficient workflows for presenting analysis, design and reinforcement results and producing clear, professional engineering documentation.
- Non-editing teacher: György Schmidt
- Enrolled students: 4